![]()
![]()
![]()
![]()
![]()
![]()
|
|
|
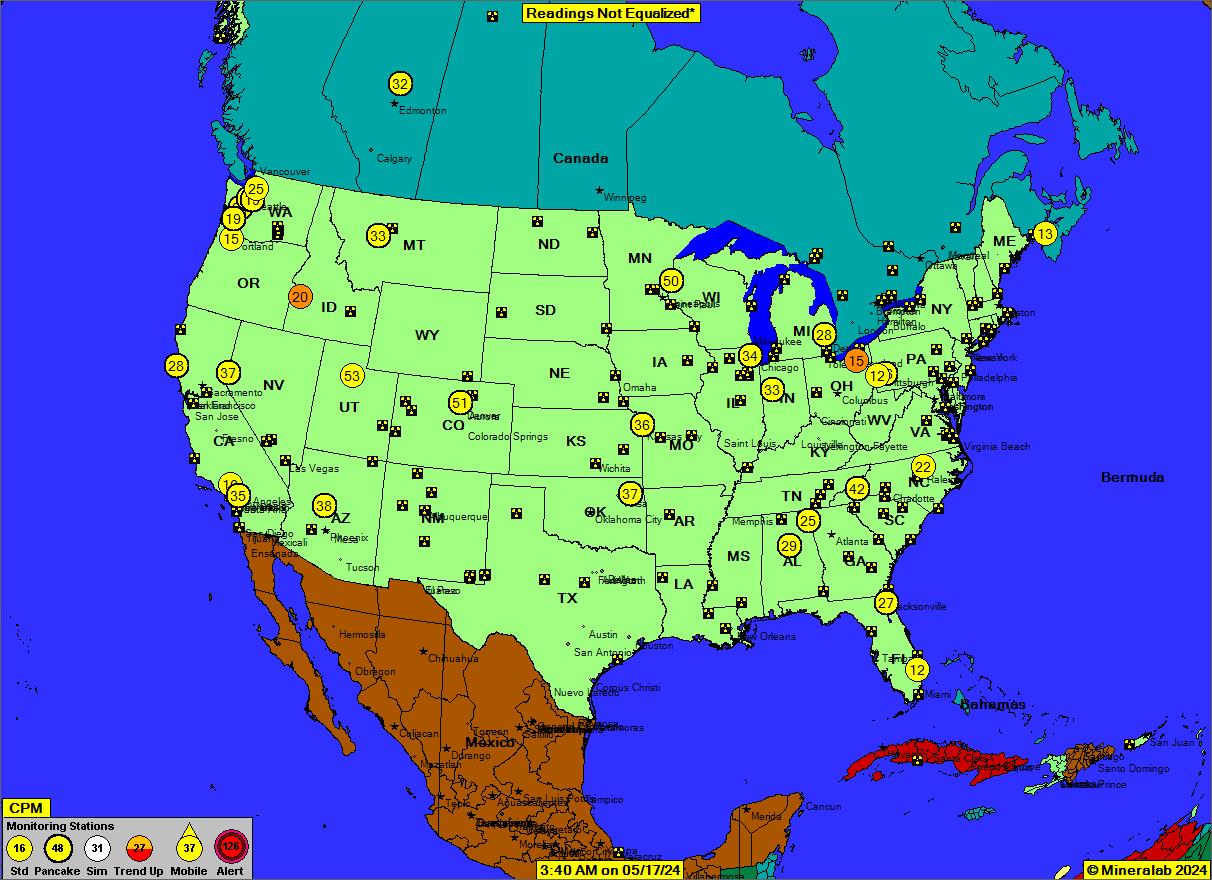
Welcome to RadiationNetwork.com, home of the National Radiation Map, depicting environmental radiation levels across the USA, updated in real time every minute. This is the first web site where the average citizen (or anyone in the world) can see what radiation levels are anywhere in the USA at any time.
*Readings not Equalized means the Monitoring Stations are broadcasting the raw radiation count from their Geiger counters, without adjustment for different count rates existing between various Geiger counter designs. For instance, models built around a "Pancake" (see Map Legend) style of Geiger-Mueller tube typically have about a 3 times count rate over Standard tubed models, so their readings in CPM would be expected to average about 3 times higher, anyway.
How the Map Works: A growing number of Radiation Monitoring Stations across the country (and world), using various models of Geiger Counters, upload their Radiation Count data in real time to their computer using a Data Cable, and then over the Internet to this web site, all of this accomplished through GeigerGraph for Networks software. This system is completely automated - there is no manual posting of data required. How to Read the Map: Referring to the Map Legend at the bottom left corner of the map, locate Monitoring Stations around the country that are contributing radiation data to this map as you read this, and watch the numbers on those monitoring stations update as frequently as every minute (your browser will automatically refresh). The numbers represent radiation Counts per Minute, abbreviated CPM, and under normal conditions, quantify the level of background radiation, i.e. environmental radiation from outer space as well as from the earth's crust and air. Depending on your location, your elevation or altitude, and your model of Geiger counter, this background radiation level might average anywhere from 5 to 60 CPM, and while background radiation levels are random, it would be unusual for those levels to exceed 100 CPM, or 2.5 times a Station's baseline readings. Thus, the "Alert Level" for the National Radiation Map is the lesser of 100 CPM or 2.5 times normal, so if you see any Monitoring Stations with CPM value above 100, and/or further indicated by an Alert symbol over those stations, it probably means that some radioactive source above and beyond background radiation is responsible. Notice the Time and Date Stamp at the bottom center of the Map, your indication of how recently the Radiation Levels have been updated to the Map. How to Participate in the Nationwide Radiation Network: If you want to join this nationwide grass roots effort to monitor the radiation in our environment, then this is all you need (click on the Software link):
In fact, if you become an active participant in this network (instead of just a passive viewer of this website), the GeigerGraph software that you use will incorporate the same Radiation Map as above, but your map will be fully interactive, with zoom capabilities, descriptions of Nuclear Sites and Monitoring Stations, additional Map Layers, including Counties, Airports, Roads, Railroads, Lakes and Rivers, as well as downloadable City Streets for your county. Plus, in keeping with the elements of a true Network, the GeigerGraph software has its own Chat forum. Compatible Geiger Counter Models:
Most of these models, as well as the GeigerGraph for Networks software, are available at GeigerCounters.com, a web site operated by Mineralab. Click on the links in the previous sentence to go there.
Disclaimer: Mineralab, LLC, the operator of this web site, can not independently verify that the Radiation Levels, or any Radiation Alerts, that are displayed on this Radiation Map are correct and valid. Among other possibilities, Geiger counter malfunctions or proximity of the counters to certain medical procedures or to radioactive items can cause high readings at a Monitoring Station.
Click here for Detailed Maps Click here for a Map of Japan Click here for a Map of Alaska and Hawaii Click here for a Map of Europe Click here for a Map of South America Click here for a Map of Australia |