|
Archived Messages from 3/18/11 to 4/9/11, listed in reverse chronological order:
Update: 4/9/11, 7:00 A.M. - Recent Radiation Alerts
On the afternoon of April 8th, a Monitoring Station located in Long
Island, New York triggered a Radiation Alert as high as 4,698 CPM
for the period of a few minutes. Our Network immediately went into action using its built-in Chat forum to determine
what was causing the Alert. The Long Island station was immediately
responsive, indicating that an after market A/C power supply for its Geiger
counter somehow caused the surge in readings, and as soon as the station recognized it had
unwittingly broadcast a high Radiation Alert over the Network, it immediately
disconnected. After a few minutes, the station resumed monitoring at
normal levels. So another false Alert.
More interesting, though, was an elevated radiation level detected by yet another
Colorado station on the afternoon of April 7th. Study the Graph at
left.
Over about a one hour period, Radiation levels at this station moved up from about 30 CPM to 42 CPM and held there at a sustained rate
for a number of hours. 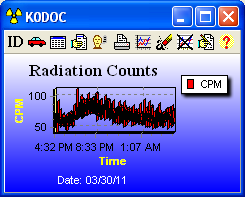 For context, this station is located in Denver, at a mile high
elevation, and is running the Radalert 50 Geiger Counter which uses a
fairly standard Geiger-Mueller tube with a lower count rate than the Inspector.
This detector is set up on a window sill, to monitor outdoors.
For context, this station is located in Denver, at a mile high
elevation, and is running the Radalert 50 Geiger Counter which uses a
fairly standard Geiger-Mueller tube with a lower count rate than the Inspector.
This detector is set up on a window sill, to monitor outdoors.
This pattern is eerily similar to what happened
with the Evergreen, CO station on March 29th. See the graph at right, for
comparison, (you can read about that below - 3/31 Update). Both of these Monitoring
Stations are on the Front Range of the Rockies, and if there is any consensus on
the cause of these elevated Radiation levels, it is that the jet stream
interacts with the high altitude of the Rockies and convective currents where
the mountains give way to the Great Plains, and "release" radiation which
falls
to the land below, and that this could be radiation drifting over from Japan.
But again, this is only speculation - we don't know.
Radiation Levels in Japan - A Monitoring Station that will soon
be joining the Radiation Network sent me a link to a You Tube video filming the
journey of some brave Japanese reporters all the way to the Fukushima
plant, with radiation detectors mounted on their car dashboard:
https://www.youtube.com/watch?v=yp9iJ3pPuL8&feature=player_embedded
If their readings
are reliable, they demonstrate how far radiation from a partial meltdown can
travel. I list below a sampling of their readings in uSv/hr, along with
conversions into uR/hr
and CPM so that you can see how these readings would relate to our National
Radiation Map:
| Proximity (miles) |
uSv/hr |
mR/hr |
uR/hr |
CPM |
| |
micro-Sieverts/hr |
milli-Roentgens/hr |
micro-Roentgens/hr |
Counts per Minute |
| Normal Background |
0.12 |
.012 |
12 |
12 to 36 |
| 19 |
1.10 |
.110 |
110 |
110 to 330 |
| 12 |
1.30 |
.130 |
130 |
130 to 390 |
| 10 |
2.50 |
.250 |
250 |
250 to 750 |
| 9 |
6.50 |
.650 |
650 |
650 to 1,950 |
| 5 |
5.00 |
.500 |
500 |
500 to 1,500 |
We in the 48 states are 5,000 miles away from Fukushima, so we are seeing
little to no elevation of environmental radiation counts from the disaster.
But the point is this - if a similar incident were to occur in the US,
God forbid, the column on the right shows what CPM levels you would be seeing
on the National Radiation Map from those Monitoring Stations located in
similar proximity to a Fukushima like event. You can observe that even 19
miles away, the corresponding CPM level is well above our Map's Alert level
of 100, so extrapolating from this, I suspect that even 50 miles away, some
of our high count stations would be triggering Alerts. This goes directly
to my point below about the Relevance of our Radiation Network - see
update from 3/20/11.

Update: 4/5/11, 8:45 A.M. Contamination detection
Much focus lately has turned to the issue of possible contamination of
water, milk, and food in the US, and how our network reporting of radiation
levels relates to that. I have addressed this general issue at length in
previous updates below, but briefly, our detectors monitor environmental
radiation, which could be restated as radiation present in air,
generally. If our detectors were in reasonable proximity to a radiation
leak exposed to the air, and logistically positioned outdoors (as
some of them are), then contaminants that ultimately could find their way into
rain water or food sources would be potentially detectable. But since the
48 states are 5,000 miles away from the Fukushima leak, which is not in
reasonable proximity, where does that leave us?
Well, we must remain vigilant in monitoring environmental radiation
levels, but as to determining if our water, milk and food are contaminated, we
should rely partly on authorities that have specialized equipment to
measure down to minute levels of contaminants. Having said that, for those
of you that have your own radiation detectors, and are concerned about
contamination, I would offer these procedural guidelines, recognizing
first that I am no expert, so my approach is instead based on some understanding
of Geiger counters and radiation detection, and then a lot of common sense.
Let's first review some basic tenets:
 | Most interested people have learned this by now, but it is worth
repeating. Even in the absence of Fukushima or the nuclear power
industry, and even going back in time before the Industrial Revolution, men
and woman have been, and are being bombarded with radiation as we
read and write this, which is of mostly cosmic origin, and this "background
radiation" represents almost all of the radiation count levels being
detected on the network. And since the human species has not only
survived, but even thrived amidst this background radiation for thousands of
years, a reasonable person (but not everyone) might conclude that this
normal background radiation is not harmful. |
| Background radiation is a random event, and this is why the CPM
levels on the Monitoring Stations jump around erratically. This fact is
the basis for a cautionary note. The single most common mistake in
radiation detection is to confuse a spike in background radiation with
radiation from a specific object. How do I know this? I am
guilty myself - when introduced to Geiger counters many years ago.
Therefore, when using a Geiger counter that is sensitive enough to detect
background radiation in the first place (not all are), you must draw
conclusions about potential radiation from a specific object only on the basis
of a sustained reading in excess of background. |
| One must be in much closer proximity to a radioactive object to get a
detection than one would normally think. As an example, I keep a
high grade sample of radioactive ore in my office (my choice only, not
recommended for anyone else) for testing purposes. Now, that sample is a
pure crystal of Uraninite about an inch around, which is highly
radioactive, by definition, and even with that, I must approach to
within about 2 feet before my counter starts to register. So the
lesson from this is that when scanning objects such as milk that are not
radioactive, by definition, but could contain contaminants, the rule is
to scan as close as possible without touching (the latter, to avoid
potential contamination of the instrument itself). |
Okay, now that we have covered those basic tenets, let's get down to the
specific details of checking for contamination. Again, a reminder, and
here is my disclaimer - these are only procedures that I
would follow, and are not represented as the best or most thorough, or
foolproof, etc. and I would urge you to do your own thinking on these matters,
and borrow ideas from others.
| First, citizens could ask their local water companies, who
typically report on water quality annually, to update tests for, and
report on radioactive contaminants since the disaster. |
| Secondly, you could do a scan of any filtration systems
associated with your individual water supply. If contaminants are
present, they might be concentrated in filters, and thus any detection
potential would be enhanced. Not that any or every water filter would be
promoted as filtering out any or some or all radioactive contaminants, but I
would scan the filters anyway. |
| When scanning the filters, remove any housing that could otherwise
shield radiation, and orient or aim any "window" on your Geiger counter
tube directly at the filter. For context, the more sensitive
Geiger-Mueller tubes incorporate a side or end window constructed of lesser
shielding material than steel, to allow penetration and therefore detection
of weaker forms of radiation (yet potentially dangerous if ingested),
including Beta and Alpha (the latter of which requires an end
window constructed of a thin sheet of Mica, typically). |
| Third, beyond scanning filtration systems, another technique to
check water, which would apply equally to any other drinkable fluid to include
milk, is to pour the liquid into a shallow container of broad surface area
and do a scan. Make sure the liquid container itself is not made of
stone or metal which are not generally radioactive, by definition, but could
be weakly radioactive and distort the test - plastic or glass are probably
best. For the same reason, make sure the liquid container is not sitting
on a stone or granite countertop or floor. |
| Start with a "momentary scan" by slowing moving the detector
across the entire surface area of the liquid, being on the lookout for a
sustained increase in the radiation level, beyond background, evidenced
by a sustained increase in the frequency of any audible clicking or
beeping, along with a sustained increase in the numerical level of
radiation shown on any visual display. |
| If the momentary scan does not reveal any radiation from the liquid, and
if you want to be more thorough, then you can resort to a "timed count"
if your detector has a setting for accumulating radiation counts over time,
and where you fix the position of your detector immediately over the liquid.
Refer to your Operating Manual for specifics. If you choose to do a
timed count, I would recommend a sampling period of at least 10 minutes, and even longer depending on how thorough you
choose to be. The idea is that if a timed count of the liquid, conducted
for say 10 minutes, shows a higher accumulation of radiation than does a similar timed
count of normal background radiation itself when removed from the liquid, then that
test reveals a weak radiation emission that the momentary scan missed. |
| Scanning food for potential contamination could be done in the same
manner, starting with a momentary scan, and resorting to a timed count
depending on how thorough you wish to be. |
As to whether your radiation detector is "good enough" to reliably
check food and water for contamination, I would answer in this way:
| Almost any radiation detector with reasonable sensitivity is better than none. |
| A detector that incorporates a Mica end window for Alpha detection is
better. |
| A detector that uses a broad diameter, pancake-style counting tube, with thin Mica
end window, is best, such as the Inspector Geiger counter. |
Finally, I lack the expertise or knowledge to say what radiation level is
too dangerous. Only you can establish your personal threshold, with
guidance from authorities that do have that expertise.
Update: 4/3/11, 5:00 A.M. Nuclear Sites
The Nuclear Sites shown on the National Radiation Map (as well
as on the Global Map for those of you who have the underlying software),
are drawn from a number of sources, but in all cases represent possible
sources of radioactivity. Here are the primary categories:
| Nuclear Power Plants - constituting the large majority of sites on
the map |
| Atomic Bomb Detonation sites - including Nevada Test Site,
Hiroshima, etc. |
| Nuclear-based Military sites - Missiles, Bombers, Submarines,
Aircraft Carriers |
| Nuclear Weapons Storage, Assembly (and Disassembly) - as in
Hanford, Washington |
| Nuclear Weapons Design - done by various National Laboratories |
| Uranium Enrichment - such as Oak Ridge, Tennessee, or Esfahan, Iran |
| Nuclear Waste Depository - as in Yucca Mountain, Nevada |
| Uranium Mining districts - located in Moab, Utah, for instance |
| Nuclear-powered Icebreakers - a small, but interesting category -
the Russians operate a fleet of these out of the port of Murmansk |
Some of you have pointed out that certain Nuclear Power Plants have
been decommissioned. This is true - our database is 6 years old,
and will be updated at some point. Others have introduced us to Nuclear
Sites we were missing, including Idaho National Laboratory (nuclear
research) and the Gasbuggy Project in New Mexico, the site of an
underground nuclear detonation to test the theory of more easily extracting oil
and gas resources. Thanks to you alert viewers for bringing those sites to
our attention.
If you know of a Nuclear Site that should be in the database,
feel free to let us know, but make sure it is verifiable, and list the
credible source for that information.
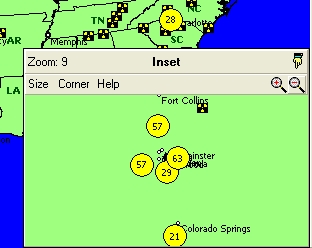 Update: 4/1/11, 6:00 A.M. Many of you have asked that we
"separate" the clustered Monitoring Stations in Colorado. Again, please
review the guidance we have provided in the comments below, but in sum, the
single web page of the National Radiation Map is but a tiny bit of the
potential information available, and rather than do unlimited postings of everything, we
ask that if you want more detail, you purchase the underlying Software that
runs the Network. Proceeds from those sales allow us to bring you the
Radiation Network in the first place. For example,
that Software has a PIP (Picture in Picture) feature that creates a Map
Inset of a busy area, while retaining display of the larger USA Map so you can
keep an eye on both. This "snapshot" was taken of the Colorado stations
this morning. Update: 4/1/11, 6:00 A.M. Many of you have asked that we
"separate" the clustered Monitoring Stations in Colorado. Again, please
review the guidance we have provided in the comments below, but in sum, the
single web page of the National Radiation Map is but a tiny bit of the
potential information available, and rather than do unlimited postings of everything, we
ask that if you want more detail, you purchase the underlying Software that
runs the Network. Proceeds from those sales allow us to bring you the
Radiation Network in the first place. For example,
that Software has a PIP (Picture in Picture) feature that creates a Map
Inset of a busy area, while retaining display of the larger USA Map so you can
keep an eye on both. This "snapshot" was taken of the Colorado stations
this morning.
Update: 3/31/11, 4:50 A.M. Questions continue to pour in
about the relatively high readings in Colorado. Up to this point,
we have noted that some of the Monitoring Stations in Colorado are at
high altitude where the lesser atmospheric shielding of cosmic radiation
leads to a higher background count. But something else happened on the
evening of March 29th which caused an elevated reading at a station
in Evergreen, Colorado.
For context, this station is at 7,500 feet, and running the
Inspector Geiger counter built around the nominal 2" diameter pancake
tube that yields a higher count rate than a standard tube. I believe
this detector was set up indoors at the time. You can observe in
the graph at right that readings began rising early evening, peaking at around
9:00 or so, and even surpassing the 100 CPM Alert level from time to
time.
We don't know what caused this. Absent further analysis, possibilities
include the passage of a radiation laden "cloud"?, at just that location
and altitude, because two other nearby Colorado stations did not register the
same elevated readings. Other explanations include a malfunctioning
detector? (although readings subsided to normal levels by morning), or
electromagnetic interference? from ham radio operation. But we
don't know.
For those of you asking, "Where can we get one of the graphs?", those
are generated by the underlying GeigerGraph for Networks software that
makes the Radiation Network possible, and any participating Monitoring
Station has access to Remote Graphs for every station on the network,
as well as Spreadsheets of minute by minute Radiation Count data.
Update: 3/29/11, 6:15 A.M. Radiation Monitoring by Government vs. Private
Citizen
So what can we take away from yesterday's incident of the false alert?
It seems to me that we must conclude that there are tradeoffs in the
ways that we monitor radiation. Government operation of
monitoring stations is under tight and direct control, but at the same time leaves open the question of transparency when
it comes to the Government's understandable position of walking a fine line between
keeping the
public informed while averting panic.
Private citizen radiation monitoring
networks like ours, in contrast, are partly dependent on the integrity of
its individual Monitoring Stations, but on the other hand, the reporting
of radiation levels is quite transparent. So if we as citizens are
to do our own monitoring of radiation, which is a very sensitive subject matter,
and then report that data to the public over a network, there are certain
guidelines that wisdom dictates we must follow:
| There still must be some degree of central control.
That includes being discriminating in issuing licenses to Monitoring
Stations in the first place, to minimize the chance of admission to the
network of those bent on mischief. |
| It then follows that the network must retain the ability to remove any
Monitoring Stations that abuse their privilege. |
| The network should provide for multiple means of communication
between client Monitoring Stations and the Network Server, along
with the ability for real time discourse among Monitoring
Stations through Chat and the like. |
In summary, this is a fledgling Radiation Network, and we are in
uncharted territory, so we must continue to learn from experience, and
refine the network over time. Dealing with the false alert from yesterday
was a small test for us. Generally, I think that we passed the test and
took appropriate action to maintain the integrity of the network, while
keeping the public informed of the facts.
The other positive take away from the incident is that it demonstrated our
Radiation Alert system. Whether you were a participating Monitoring
Station or a passive viewer of the National Radiation Map online,
from hundreds or even thousands of miles away, you
knew within just 1 minute of an elevated radiation condition,
along with the location of the alert, and then the actual
level of radiation being detected. Think about it - that's pretty
amazing!
Update: 3/28/11, 8:40 A.M. Here is follow up on the
Radiation Alert from this morning. The Monitoring Station in question
is located in Huntsville, Alabama. It triggered alerts based on
radiation levels averaging in the 100 to 150 CPM range. We tried to
reach the station through a number of different means, including via the Chat
forum available from within the Radiation Network, but to no avail.
So after a half hour or so, we contacted the Huntsville Fire Department
and recommended they take independent radiation readings in the vicinity
of the Monitoring Station. After all, Huntsville, AL is located about 30
miles from two different nuclear power plants, so we had to take this alert
seriously. Fortunately, their readings showed no elevated radiation
levels above normal background. After some time, radiation levels from
the Monitoring Station in question dropped first to 0, then resumed at normal levels.
But still receiving no response from the station, we disabled it,
essentially removing it from the Radiation Network. We want to
thank the Huntsville Fire Department for their timely support in this
matter. I will write more on this incident later.
Update: 3/28/11, 6:05 A.M. Something triggered a
Radiation Alert this morning at a Monitoring Station in northern Alabama.
We are trying to track down the reason behind it.
Update: 3/27/11, 6:00 A.M. - Logistics of Monitoring
A number of emails have asked about the logistics of the compatible
Geiger counters. First of all, it should be stated that the models of
detectors contributing to the radiation count over the network are not
waterproof, not intended for permanent outdoor installation, and owners
should be aware of any related manufacturer warranty issues. Having said
that, some of our Monitoring Stations have improvised outdoor or
semi-outdoor positioning of the detectors to protect them from the elements,
while exposing them to that environment to better "sniff" the air, and
all this while remaining connected by the data cable to a protected computer
with an Internet connection, and then running the software that underlies the
Radiation Network. This logistical feat!!! is probably an
optimal setup.
All of the compatible Geiger counters contributing data to the Radiation
Network detect X-Rays, Gamma rays, and Beta radiation, and
almost all of them in current use can also detect Alpha radiation by
virtue of a Geiger-Mueller tube with a thin mica end window. Furthermore,
about half of the detectors contributing data are the Inspector model
built around a "pancake" style tube with a nominal 2" diameter surface
area, putting them in the ultra-sensitive category.
X-Rays and Gamma rays are quite strong and can pass through the walls
of most structures, so even indoor monitoring is therefore relevant. In
contrast, Beta and Alpha radiation are relatively weak, so to detect
those classes of radiation in the environment, the detectors would generally
need to be positioned outdoors to better "sniff" the air. I might
add that, for those stations that typically monitor indoors, you can disconnect
periodically to sample outdoors preferably using a "timed count", to
either confirm indoor readings, or to reveal any higher count that is apparent
from directly sniffing the air.
Emailers have asked whether these Geiger counters detect plutonium,
etc. In answer, these all purpose detectors lack the ability to
discriminate by radioactive element or isotope, and instead simply detect and
quantify only a total radiation count of all X, Gamma, Beta, and
Alpha radiation present. And since these radioactive contaminants emit an
array and combination of Alpha, Beta, and Gamma, they are theoretically
detectable, and in practice are in fact detected if in strong enough energy
levels. Just keep in mind that radioactive detection generally is a
function of the strength of the radioactive source combined with the
proximity of the detector to that source. Continue to rely on the EPA
or other sources for information on specific radioactive contaminants.
Update: 3/23/11, 5:15 A.M.
Until some Japanese Monitoring Stations come on line in the Radiation
Network, I received a verbal report from a customer of ours from Japan, living
in Kawasaki City, a southwest Tokyo suburb, which puts her about 150
miles from the ailing Fukushima nuclear power plants. She reported a
radiation level of .16 uSv/hr, which equates to 16 uR/hr, and that
levels have been rising a little bit. Since normal background is perhaps
12 to 15 uR/hr, depending on location and altitude, her levels are not too bad
at that distance.
Update: 3/20/11, 11:30 A.M.
| Relevance and Perspective - While most visitors to the
Radiation Network are generally glad to find any actual
radiation count data in the US, some have questioned the
relevance of the data provided. After all, there is just a
handful of Monitoring Stations, we have no breakdown of Alpha, Beta,
and Gamma radiation, and no information on Iodine, Cesium, and
Plutonium contaminants, and no easy way from the site to discern potential
trends in rising radiation levels (the latter item is a fair point
which I discuss separately below). Furthermore, while other sources
indicated that radiation had reached California, this network doesn't seem to
have detected that! These criticisms are all true. |
| But let's take on some perspective here. Our Monitoring
Stations, as mentioned yesterday, do not use specialized detectors - they are
designed to return only a Total Radiation dose rate, certainly including
Gamma rays which can pass through the walls of most structures, and
also including Beta and Alpha radiation in the atmosphere in those
cases where the detectors are setup outdoors or in a screened window, where
they can better "sniff" the air, as some of our Monitoring Stations do, or as
I did with my two models of detectors yesterday morning (see below). |
| So with all of these points, does that mean the Radiation Network data
is irrelevant? The answer is an emphatic No! because
if the data were irrelevant, then so would be the radiation detection data of a First
Responder in NYC, because they use essentially the same detectors as we do.
All we have done with the Radiation Network is to have found a
way to link such detectors together across the country to create
some sort of National Radiation Map in real time, and then made
that data available to the public - nothing more and nothing less. |
| So then, what is the conclusion that can be gleaned from the data
on the Radiation Network? Well, our Monitoring Stations have not
yet registered a big, or even perceptibly significant "Gamma event" from
any radiation drifting over from Japan, so we can take a little solace in that. You know, there is an interesting
paradox in
the field of radiation monitoring. On the one hand, we might use
a Geiger counter to perform a
radiation scan of a suspected object or situation, and in a weird sort of way,
we want a "hit" to confirm our fears, but on the other hand, if we don't get a
detection, some of us are understandably a little disappointed. But in
that case, of course, we should instead breathe a sigh of relief. |
| So back to the issue of relevance, I dare say that if our stations
were within some reasonable proximity of, instead of 5,000 miles away from, a
similar nuclear accident closer to home, God forbid, you would be seeing a
major Gamma event over the Radiation Network, with CPM or uR/hr levels
not in the 10's or 20's or 30's, but probably into the 100's or 1000's.
In that case, the data from the Radiation Network would probably be deemed
quite relevant by all, including current skeptics. So I think this
controversy comes down to a matter of degree. |
| Having made this defense, we must not conclude that there is no radiation
risk. It is probably helpful to think of the Radiation Network as a
"First Responder" to any broad indication of radiation danger, and
continue to rely on the EPA and other sources as the "HazMat" teams
using specialized equipment, to advise us on any danger from specific
contaminants and the like. And meanwhile, we should continue
monitoring because this situation is ongoing, and even beyond that, for
whatever comfort the Radiation Network may provide. |
| I mentioned above my agreement with the constructive criticism of adding
some sort of trend or moving average data for the Radiation levels,
to better alert us of an incoming "cloud" or "plume", and while that
data is available to those who use the underlying software, I do think it
would be a very pertinent addition to the Radiation Map. So we'll
work on that. Thank you very much for the suggestion! |
Update: 3/20/11, 8:15 A.M.
| Some housekeeping first - We uploaded a Map of Europe
that you can link to from the bottom of the main USA Map page. Europe is
live, although we have only one intermittent Monitoring Station
running there right now. |
| Detailed Data - Requests continue to pour in for data on the
identity of Monitoring Stations, the ability to separate overlapping
stations (which can be done through the Picture in Picture feature
in our Software), a detailed list and identity of Nuclear Sites, and
that some are decommissioned, etc. I have addressed this point in my
original Message below, but to review, what you are seeing on
RadiationNetwork.com is only 1% of the information and capability
available versus the resources under your control if you actually had a
copy of the real software, GeigerGraph for Networks, that makes
all of this work. The sales of that software provide the funding that
enables us to bring you Radiation Network.com. You will notice
that our web site here has no distracting ads or pop-ups - we just sell
the software instead, you know, the old fashioned way. So here is the
link: |
http://www.geigercounters.com/NetworkVersion.htm
|
And if you have the Software itself, loaded on your
local computer, you will seldom need to use RadiationNetwork.com (that's
just for passive viewers), and would seldom want to because at that point, you
begin managing the massive amount of information and capabilities through
the Software interface.
|
Update: 3/19/11, 2:30 P.M.
| Many emails this morning have pointed out that the Radiation readings
reported by the EPA from many of their stations in the West are much
higher than those on the Radiation Network, and asked that we square the
EPA readings with those from the Radiation Network. I will study the
EPA data in more detail, but at first glance, the explanation for the
difference goes back to a couple of points I made in my earlier update below: |
| When reporting radiation readings, units of measurement matter.
The EPA readings are apparently in CPM (Counts per Minute), but CPM
levels are not standardized, and instead depend upon the design of each
model of detection instrument. So readings in CPM are not comparable
except to historical readings made by the same instrument. I am
hoping that the EPA detectors are something much more specialized and
sensitive than the models typically used by our Monitoring Stations.
For example, if a "counting tube" has a larger physical size and greater
surface area, then it follows that the count rate, measured by the number of
radiation particles that it "captures", will thus be higher. |
| In contrast, the type of Geiger counters typically in use by Monitoring
Stations in the Radiation Network are best described as personal
radiation detectors or of the type commonly used by first responders,
and in many cases, the exact same model in use by the NYC Fire Department. These counters are built around a fairly standard
sized "counting tube", and in many cases better, but having said that, are obviously sensitive enough to
detect background radiation, and them some. |
| So bottom line, the question for the EPA is can their CPM
measurments be converted to a standardized unit of measurement, such as
uR/hr, in the same way that the CPM levels on our Radiation Map are
roughly equivalent to uR/hr as well, subject to the qualifications I cited
below. |
| As a double check on my reasoning here, I stepped out of my Prescott,
Arizona office this morning with two different models of Geiger counters, to
sample environmental radiation levels, and found the total level
quite normal for our mile high altitude, in the 15 to
20 uR/hr range. Interestingly, this mimicked the readings I was
getting from a similar detector indoors in my office. |
| In summary, this is not to say that the environment outside my office here
lacked any radioactive contaminants at all, but their presence was not
detectable by just a general sampling of the environment. We will, and we
should leave it to the EPA to break a total radiation level down to its
constituent parts. |
Update: 3/18/11, 6:00 A.M.
| Radiation Levels - As of this morning, background radiation levels
from our stations on the West Coast still look pretty normal, when
disregarding the randomness of background radiation in the first place.
As an indication of foreign radiation moving into the environment, such as a
gamma laden cloud, keep on the lookout for a sustained increase and
trend in background levels over time, to where multiple stations start
averaging first in the 40's, the 50's, and 60's to 100 CPM range.
Keep in mind that spikes and troughs in readings for any one minute are not
relevant - only average readings at a sustained rate are meaningful. |
| You have responded! - We asked you to set up your own Monitoring
Station, and the response has been overwhelming, and you are already
seeing new Stations popping up on the map. Unfortunately, we have
sold out of Geiger Counters for the time being, and that is now the limiting
factor. Until we are re-supplied, I can tell you that there are already
tens of thousands of compatible Geiger counters already out in the
marketplace, from acquisitions over the last 20 years, that are in the hands
of your local Fire Departments, or collecting dust in drawers in homes,
businesses, and universities. So review again the compatible models
listed on the Map page, and if you know someone in that category, see if they
can't put those detectors to work. We can supply the required
Software and Data Cables to "plug in" to the Network. |
| Media Coverage - Our work and your interest is paying off.
Just in the last two days, we have seen media coverage from, and done
interviews with everyone from the New York Times to Fox News,
along with a myriad of talk shows, alternative media, local press, and TV
network affiliates. At a time when our government continues to assure of us of
no radiation danger, yet fails to follow that up with actual collection data,
the media is noticing that our network is one of the few
resources where concerned Americans can obtain data on actual
radiation levels in at least some locations in the US. |
| Alert Level - You are an astute group! A few of you already
noticed that we recently lowered the Alert Level for the Map from 130 to
100 CPM. It was probably too high in the first place. The
optimal setting for a Radiation Alert is one that is not so low as to
invite false alerts from momentary spikes in radiation, yet not so high as to
defeat its original purpose. |
| Stations disappeared - Why did the Monitoring Stations in NM and TX
disappear, you ask? It's like the TV in your family room - it's always
there, but where some people watch TV all day long, others turn it off for
awhile. We can't control that - running a radiation Monitoring Station
on our Network is as voluntary as watching TV - nothing sinister about it. |
| High readings in CO - The Radiation levels on the stations in
Colorado are higher on average than the others because some are at
elevations as high as 8,000 to 9,000 feet, where there is less
atmospheric shielding from the cosmic rays that make up most of what we
call the background radiation count. As an example, I have taken a Geiger
Counter on a passenger plane flight and recorded readings up to 800 CPM at
40,000 feet! So those high readings are quite normal for certain
Colorado stations. |
| Bakersfield - Due to some confusing news coverage, a report and/or
rumor circulated that one of the Monitoring Stations on our Network recorded a
spike or reading of 222, or something like that (I don't know what unit of
measurement was supposed to accompany that number.) Anyway, the story
is false. This network has never operated a station in
Bakersfield. Because of the sensitivity of the subject matter, i.e.
potential radiation danger, we must caution ourselves to deal strictly in
fact, and resist the rumor mill. To illustrate the point, I know for
a fact that our Monitoring Station in Vancouver, BC just recorded a
reading of 14 CPM in the last minute. That is a fact, not
speculation, not rumor. If someone is claiming this or that, ask them to
back it up. |
| Units of Measurement - It is confusing - Rems, Rads,
Roentgens, Sieverts, CPM, mili, micro... In the US, the standard unit to
quantify dosage is the Roentgen, or more particularly, usually milli-Roentgens
per hour, abbreviated as mR/hr, or micro-Roentgens per hour, written as uR/hr. |
| Meanwhile, in Japan and most other countries, the common unit is the
Sievert, and in practice usually micro-Sieverts per hour, written as uSv/hr.
It is easy to convert - 1 mR/hr equates to 10 uSv/hr, so a reading out
of Japan of 500 uSv/hr would equal 50 mR/hr - just divide by 10. Some
people use the term Rads or Rems as substitutes for Roentgens, and for all
intents and purposes, they are interchangeable, although not scientifically
correct. |
| A cautionary note - because of the large array of radiation units,
when stating a reading, it is meaningless, dangerous, and irresponsible to
give just the number - always follow that number with the corresponding
unit of measurement - not doing so breeds wild rumors. |
| But the Radiation Map uses CPM - why? Well, because
CPM, or Counts per Minute, corresponds directly to the output of the
compatible Geiger Counters, and CPM levels are also user-friendly integral
numbers. Problem is, some Geiger counters, particularly those that use
the "pancake" Geiger-Mueller tubes, are more efficient than others and detect
a higher count rate than standard tubed models - up to 3 times, which also
explains why some stations on the Map show higher levels than others. We
are going to correct that in future software versions, and adopt the uR/hr
standard. But the CPM unit serves us for now, and as it turns out,
the CPM readings for standard tubed Geiger counters does in fact equate
exactly to the same readings in uR/hr. |
| Accuracy of Readings - While most visitors to the Radiation
Network welcome the service, a few have questioned the accuracy and
legitimacy of the radiation readings. That healthy skepticism is a
good thing, especially given the sensitive nature of this subject
matter. I can only say that we don't have an agenda, other than
the collection and reporting of Radiation levels taken on a scientific
basis. Since our network is of a server/client nature, we exercise
some control over the issuance of Monitoring Station participation in the
first place, and retain the ability to shut down any station that abuses its
license. Having said that, I am very pleased with, and proud of
the makeup of our Monitoring Stations. These are largely just
individuals like you and me who are concerned and aware,
diligent in recording readings, and interestingly, many of them are ham
radio operators at the same time. |
So continue to send your emails. While I haven't the time to respond to
most, I can glance at them and get the gist of your thinking, and then use this
forum to answer questions common among you. While I love those
phone calls expressing appreciation for what our Network is doing, please limit
calls from only those of you who can operate Monitoring Stations in the
instance where you already have a compatible Geiger Counter, and where we
can provide you the Software and Data Cable, if needed. Thank you again
for your support. Tim Flanegin
We have received a lot of feedback on our
Radiation Network, including gratitude for this service, and we really
appreciate the support. A lot of suggestions and questions
(and some complaints) have been forwarded as well, so I would like to address
those here, because we do not have time to respond to your individual email
messages.
The messages range from Where is Hawaii and Alaska to Why
aren't there more Monitoring Stations, etc. So for starters, this is a
privately founded, owned, and operated network. We are not
affiliated with the government in any way, and therefore, we lack the unlimited
funding that our government seemingly has. Otherwise,
we would gladly set up 1,000 Monitoring Stations in the US, including Alaska and
Hawaii. What that means, therefore, is that the Network is dependent on
us to set up Monitoring Stations, where all you need is a compatible
Radiation Detector and the Radiation Network Software. We can not force
anyone to operate a Monitoring Station - if we don't do it ourselves, it won't
happen.
Many have asked for more details on Monitoring Stations and Nuclear Sites,
etc. We would love to give all the data away free, and spend unlimited
hours posting all of it on the web site for public benefit, but we fund this
network out of our own pocket through the sales of our GeigerGraph for
Networks Software that makes this all possible. So if you want the
full capabilities of the Network, the Maps, and the Data, we ask that you shell
out a few bucks for the software. Sorry - a little capitalism at work here
- it's how we make our living.
So the main point is this: We need more Monitoring Stations! The
data is thin. So if you want to help, get a hold of a compatible detector,
and set one up. Like any volunteer effort, it is up to us.
Now for some individual issues:
| Web Site status - Yes, our site was down on 3/15 for awhile, but
due to a technical mistake on our part - there was no sinister explanation
behind that.
|
| Alaska and Hawaii - We posted "static" maps at this link -
AK and HI.
|
| Global Map - This network is potentially global. One our
members from Norway was operating his Monitoring Station
yesterday, and we continue to urge a couple of our members in Japan to
run their stations and "plug in" to the Network. |
Back to the Radiation Network
Back to the Message page
Click here to go to the next Archive
|