
![]()
|
|
|
Archived Messages from 1/26/13 to 5/12/13, listed in reverse chronological order: Update: 5/12/13, 9:00A.M. - Radiation Network Graph for All Stations Combined With the steady growth of the Radiation Network, we now have a sufficient number of real-time contributing Monitoring Stations to make Network-wide averages meaningful and statistically significant, so we have started tracking them.
You can see that we record the Number of Stations making up the average, both their Raw count and their Equalized readings, whether they are Pancake models, and the average Altitude of all stations. While the Radiation Network has contributors from across the globe, most of our Monitoring Stations are located in the US. We will add that statistic. Here are some examples of what we hope to glean from this Network-wide average:
For instance, look at the network-wide spike at the beginning of May. While the reason for that (which is kind of embarrassing) is a software glitch that bunches two minutes of activity into one at each monthly rollover, that nevertheless serves to demonstrate the kind of graph pattern that can clue us into a genuine elevated radiation occurrence. The real time graph, updated hourly, can be found on our Graph page. I recognize that this Network-wide averaging attempt is not a perfect representation from a technical standpoint, but it's something, and it's a start.
Follow-up: The recent Update of the Radiation Surge in Texas generated a very interesting and informative email response, paraphrased here with permission:
"I previously worked at a nuclear weapons plant as
a senior physicist and am familiar with the products assembled and
disassembled at Pantex. The observing station may have seen a
release of tritium, H3, gas. The decay process is beta with an
energy range from 0 to about 18KeV. This is low energy and easily blocked.
They should check the local weather report for wind direction. If it's
coming from the Pantex plant, then that's the likely culprit.
Fortunately, hydrogen disperses rapidly in air and does not react readily with
body chemistry. You can breath it in, but nearly all will come back out
during the exhale. H3 in the form of water is a different story as much of
it will be absorbed." (and when questioned about a beta source from
outdoors being detectable through the walls of a home?) "You would
see tritium in the air as it will pass through the house in the normal
fashion. With a high wind, the tritium cloud would disperse and pass
quickly. (Pantex) may have released it from dismantled weapons thinking
the strong wind would disperse it quickly and nobody would notice. That's
just a guess." On April 13th, at 8:57 PM local time, one of our stations in North Texas recorded a 3 minute surge in readings. The cause is unknown. The station's normal background is about 40 CPM. He operates the ultra-sensitive Inspector Geiger counter, indoors on a second floor near a window, at his elevation of 3,000'+, so that 40 CPM average is expected. But the surge came seemingly out of nowhere, first rising to 87 CPM, then 119, then spiking to 177, before immediately dropping back to normal levels. The station operator indicates no one was outside passing by, and that the highway is 2 miles away. His theory - that "a radioactive particle... got stuck to the window and then blown off - winds are very strong right now". I would add that this elevating pattern, in the middle of continuous monitoring, and spanning 3 minutes, tends to rule out a connection glitch or the like, so this Alert seems real. In case this is relevant, the same station recorded a half hour of elevated readings a few months back - scroll down to the Update: 11/24/12 - where we pointed out his 25 mile proximity to the Pantex nuclear weapons facility.
Update: 3/16/13, 12:06 P.M. - Good Morning, Vietnam!
Notice also the ebb and flow of the readings over the course of 3 days of mostly continuous monitoring. She is not sure of the reason, although the Geiger counter was logistically set up in a concrete structure. As to the very interesting ebb and flow pattern, that mystery remains to be solved. There is obviously a lot to learn about radiation monitoring in Vietnam. We express our gratitude to the Maine station for broadcasting readings during her travel to the Far East.
Over the last day, a Monitoring Station on the Radiation Network located in Grand Rapids, Minnesota (not MI), registered what could only be characterized as a wild ride. You can see in the graph at right that readings from this morning sustained 100 CPM for many hours today, until trailing off only late afternoon. The station operator is out of town, but reports "nothing has changed in the setup and the location of the meter from before. The door was locked when left, and no animals in the room. We also just got 10" of fresh snow on Sunday night and Monday, so that could be causing it as well." For other clues, this station has been among the most "active" since joining the network. He operates the ultra-sensitive, high count rate pancake tubed PRM-9000 Geiger Counter, and monitors indoors near a window. Scroll down to the 10/22/12 Update for history. One of our members offered another theory that I would like to offer for consideration, without taking a position on it. Paraphrased - "Several of the recent alerts have come from locations near hydraulically fractured wells. Certain radionuclides, including Iodine 131, are among those used as tracers to map fractures. Tracers, in addition to radium, return to the surface with the flowback and gas. Wastewater is sometimes kept in evaporation ponds or dumped nearby. Could be a possible source." I find this theory especially interesting in attempting an explanation for Grand Rapids, since that station is located downstream of prevailing winds from the petroluem production fields in Dakota.
Update: 1/26/13, 8:30 A.M. - Map and Network Enhancements As we approach completion of a new version of the underlying software that runs the Radiation Network, we are using that version to phase in some new features on the Maps and Network:
https://radiationnetwork.com/Graph.htm
Thanks again for your support. Tim Flanegin Back to the Radiation Network Click here to go to Archived Messages |
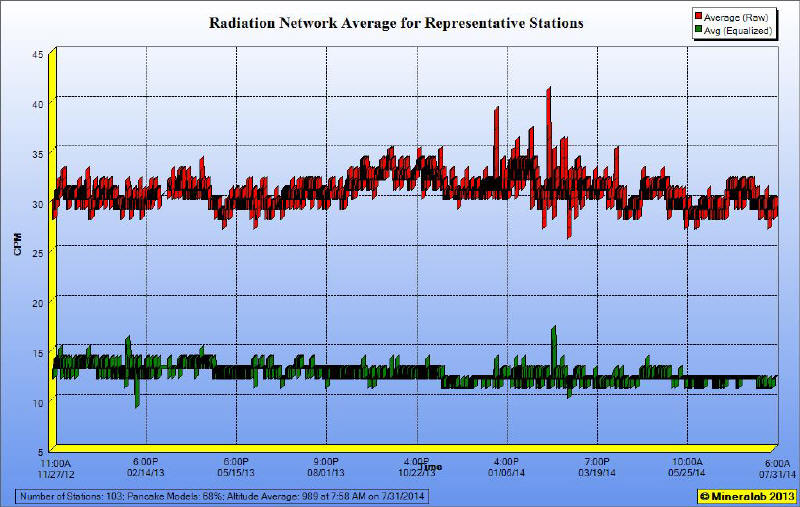 The example graph here covers almost one month of activity at this point.
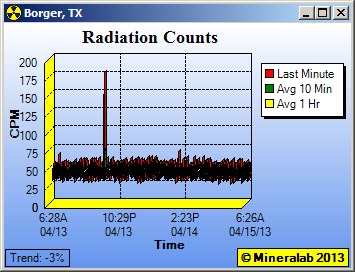 Update:
4/15/13, 6:30A.M. - Radiation Surge in Texas Panhandle
Update:
4/15/13, 6:30A.M. - Radiation Surge in Texas Panhandle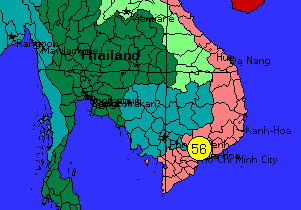 One of our Maine based Monitoring Station operators recently traveled to to the Far
East, and was broadcasting from Vietnam. She was located
very near Ho Chi Min City (formerly Saigon), and was operating the standard tubed
Radalert 100 Geiger Counter.
One of our Maine based Monitoring Station operators recently traveled to to the Far
East, and was broadcasting from Vietnam. She was located
very near Ho Chi Min City (formerly Saigon), and was operating the standard tubed
Radalert 100 Geiger Counter.
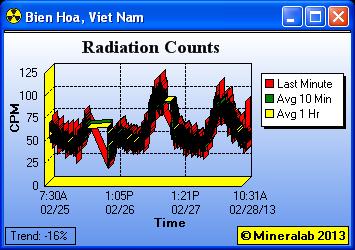 While her readings while in Maine are rather
normal, averaging in the teens, she
was recording elevated levels in Vietnam
generally, even triggering the 100 CPM Alert level occasionally.
While her readings while in Maine are rather
normal, averaging in the teens, she
was recording elevated levels in Vietnam
generally, even triggering the 100 CPM Alert level occasionally.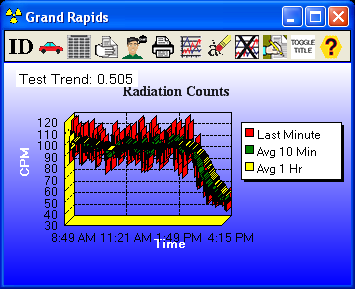 Update: 2/13/13,
4:40 P.M. - Wild Ride in Minnesota
Update: 2/13/13,
4:40 P.M. - Wild Ride in Minnesota