
![]()
|
|
|
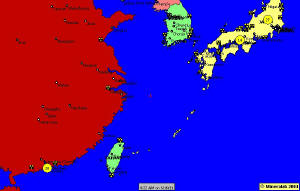
This morning, a new Monitoring Station in Hong Kong joined the Radiation Network. See the Map at right, showing the yellow circle at the southern end of China. This station runs the standard-tubed Monitor 4EC Geiger counter capable of detecting Alpha, Beta, and Gamma radiation, and for starters, is monitoring indoors. He is close to sea level, but his background radiation count of 26 CPM is pretty high. Normally, you might expect a Monitor 4 at sea level to register background at about 12 CPM, so why the high reading? We are exploring a couple of theories. While the detector is not sitting on any kind of stone countertop, the building itself is concrete which, while not radioactive by definition, can emit a weak radiation signal. To test this theory, the Hong Kong station will do comparative outdoor surveys well removed from any concrete structures. The second theory is that his Geiger counter may be picking up radioactivity from an atmosphere polluted by coal-fired power plants. That's right - I said coal, not nuclear. From the EPA, "Coal contains trace quantities of the naturally-occurring radionuclides uranium and thorium, as well as their radioactive decay products, and potassium-40. When coal is burned, minerals, including most of the radionuclides, do not burn and concentrate in the ash. While most of the ash is captured, tiny solid particles known as 'fly ash', including some radionuclides, escape from the boiler into the atmosphere." Many of us have seen the news reports that China is already operating and continues to build large numbers of coal-fired power plants to fuel its fast growing economy. The Hong Kong station confirms that its metropolis is powered by its share of coal plants, and adds that in the capital of Beijing, the "pollution is horrendous". So, if we have a significant follow-up on this issue, we will let you know. In the meantime, you may find intermittent live readings from the Hong Kong station as part of the uploaded Japan map.
Update:
6/11/11, 8:00 A.M. - Hawaii station detects Fukushima Radiation? Early yesterday morning, at about 3:00 A.M. local time, one of our new Monitoring Stations in Hawaii broadcast a Radiation Alert over the network, reaching a sustained level of over 100 CPM (Counts per Minute) for a period of about 15 minutes, peaking as high as 141 CPM at one point. The readings then subsided to normal background levels of about 37 CPM for that station, but within less than 2 hours, trended quickly up again to over 100 CPM for another 5 minutes or so. The graph at right depicts this activity.
The station is operating a traditional Geiger counter, affixed with an external probe built around the same ultra-sensitive, oversized pancake tube as in the Inspector line of instruments, so it is capable of detecting low levels of Alpha, Beta, and Gamma radiation. Data output is through the headphone jack of the survey meter. The Geiger counter is set up for outdoor monitoring, protected from the elements under the eaves of the structure, with the thin mica end window of the Geiger-Mueller tube oriented downward to prevent contamination from possible fallout. So those are the facts of the case. The question now is, "Did the Kauai station detect radiation emanating from Fukushima?" To answer that, let's review these points:
Update: 6/9/11, 8:20 A.M. - RadiationNetwork.com down Last evening, our web site RadiationNetwork.com went down. Since we use that site to upload the Radiation Maps for the benefit of the general public, there is a perception that the Radiation Network itself went down. But this is not so - the Monitoring Network continued uninterrupted during this period, and contributing members of that network were still sharing their radiation count data over the network, and monitoring activity using the Radiation Maps and Remote Graphs available within their copies of the underlying software which "run" the network. Here is the back story, though. After the terrorist attack of 9/11, when Americans didn't know what might hit them next, we conceived of this idea of creating a citizen-based radiation monitoring network, and proceeded to develop software which linked together radiation detectors from across the country to create a sort of National Radiation Map. Initially, there was a lot of interest in the general idea, and we issued a number of licenses for Monitoring Stations. But with the passage of time, and the absence of any radioactive "event", interest waned, human nature being what it is, and our network reverted to a semi-dormant status for a number of years - until Fukushima. At that point, the die-hard Monitoring Stations that had loyally operated through the dry years were suddenly joined by dozens of new contributors, but more to the point, concerned citizens flocked by the thousands to RadiationNetwork.com in desperate search for any information they could get on potential radiation danger. Well, that triggered a bandwith overage with our web host because we had reverted to a low cost hosting package to get us through the semi-dormant years. As soon as our web host notified us of the overage, however, we immediately upgraded our site to premium, unlimited bandwith status, which was supposed to fix the problem. But because the left hand of the web host (who shall go unnamed) was not talking to the right hand, our web sites were unexpectedly shut down. Early this morning, the sites were re-activated, and hopefully this outage will not recur. The good news is that since we administer the actual Radiation Monitoring Network through our own server, it continued to operate uninterrupted. So, there was nothing sinister about the "shutdown", and our apologies for the outage. We know that many of you have come to depend on RadiationNetwork.com as one of many sources for information on radiation levels. This is probably a good opportunity for a reminder, though: For those of you wanting more information and capabilities beyond that available to a passive viewer of our RadiationNetwork.com web site, you can purchase a copy of the real software, GeigerGraph for Networks, that makes all of this work. Installed on your local computer, you then have ability to zoom in on the Map to separate clustered stations (or use Picture in Picture), Spin the Globe over to Hawaii or Japan, Identify Monitoring Stations by Geiger Counter model, altitude, etc., look up Nuclear Sites, access Remote Graphs and Spreadsheets of radiation count data for every station to identify trends, engage in Chat with other Stations on the Network, and much more. Thanks.
A new Monitoring Station in Japan registered a passing radioactive cloud in the last 24 hours. This contributor is located north of Tokyo, on the Fukushima side of the metropolis. The station operates a 20 year old Radalert, a standard-tubed Geiger counter able to detect Alpha and Beta radiation, in addition to Gamma and X-ray, of course, and in this case, was set up for indoor monitoring! His background count is somewhat high for that model, which may speak to an elevated environmental radiation level, post-Fukushima. Trendwise though, the graph at right shows the "wave" of the passing cloud, accelerating in the late evening, peaking after midnight at around 40 CPM, then falling over the course of the early morning, and finally troughing at around 7:00 A.M to about 30 CPM. The ailing Fukushima nuclear reactors are giving new meaning to the term un-cool, and as long as they remain so, they "operate" un-controlled as well, and the Japanese archipelago bears witness to and remains victim of this radiation fallout. Keep your eye on the Japan map within this website for similar evidence in the future.
Update: 5/29/11, 10:30 A.M. - Contamination checking - follow up Mother Nature showered us with another unseasonable rainfall here in Prescott, Arizona on May 18th. This time though, the radiation check turned up negative (in the medical sense of the word, that is). Using the same procedure as before, the captured rainwater read 21 CPM, versus background of 22 CPM. I also scanned some milk from the local supermarket, and that turned up normal also - 21 CPM. Then I just couldn't resist - for umpteen years, I have read and heard that bananas are radioactive?, so I scanned one, but that effort also proved "fruitless" - the same 21 CPM. Now, I can imagine what the radiation mythologists are protesting, "Ahhh, but the peel was on, so surely that explains why your banana did not turn up radioactive." So okay, I peeled the banana, cut it in half revealing its cross section, and scanned the nitty gritty center, seeds and all. Answer, 20.4 CPM - sorry, guys (or maybe I just had an uncooperative banana). My theory on this is that someone long ago confused benign potassium content in the banana with radioactive potassium isotopes, and everyone since then has repeated the myth, instead of doing original research like I just did. Even if a real scientist could prove to me that bananas are radioactive, what's the point? It is tall tales like this that give many people the wrong impression that, "Well, everything is a little radioactive" when in fact that myth is based upon the misidentification of ever-present background radiation for radiation from a specific object, because after all, "When I turned on my new Geiger counter and put it up to my cat, it started clicking, so even my cat is radioactive..." Back to the real world - I performed a radiation scan of Soy Sauce, specifically of the Kikkoman (Tamari) brand, and the label clearly indicates it was brewed in Japan. There is no date printed, but my wife believes it is pre-Fukushima. Because this food item originates from Japan directly, I upped my timed count from 20 to 30 minutes, and this time switched to using the ultra-sensitive, high count rate Inspector. Results - Soy Sauce, 63.9 CPM; Background 63.4 CPM, so this Soy Sauce is free of radiation. This test will serve as a baseline for comparing future brews in the ensuing months. BTW, I proceeded to scan the Sake in our wine cabinet, but wouldn't you know it? - brewed from California rice! Will have to get a brand directly out of Japan - stay tuned.
Update: 5/15/11, 10:40 A.M. - Rainwater contamination Up to now, I have indicated that I have found no contamination in my rainwater, from a couple of previous tests. This changed, however, on May 10th when we received an unseasonable 1/4" rainfall here in Prescott, Arizona. The family car had been outdoors in the rain, so I wiped an otherwise clean, but wet window with a paper towel, brought that inside, and laid it on a paper plate, which itself was sitting on a wooden table. First, I attempted a momentary scan with my Digilert 100, a "standard" tubed Geiger counter, aiming its thin mica end window directly at the wet towel, slowly surveying the surface area. But the momentary scan did not indicate any perceptible radioactivity. So in the interest of thoroughness, I resorted to a 20 minute count, using the Total/Timer mode of the Digilert, fixing the position of the instrument, with the end window oriented directly at the water-soaked towel just 1/4" away. At the end of the test, the instrument had accumulated 514 radiation counts, or about 26 CPM (Counts per Minute). Then I created a scientific control, conducting a similar 20 minute count on an identical paper towel moistened with tap water this time, sitting on an identical paper plate, and in the same position on the same wooden table. The accumulated count was 407, or about 20 CPM. If that comparison wasn't enough to indicate slight radioactivity from the rainwater, I looked at my logged average of indoor "environmental" radiation for the previous 20 minutes before disconnecting my Digilert from the computer to scan the water, and wouldn't you know it, but that was also 20 CPM. So short of an even longer timed count, this analysis almost certainly revealed that the captured rainwater was emitting 6 CPM of radiation. What are the lessons here?
Back to the rainwater, though. The question is, "Was the radiation in the rainwater from Fukushima?" I have received input from two scientists indicating that there is a natural explanation for radioactive rainwater. By one account, the atmosphere includes radon gas among the other elements, and radon "daughters" are brought to the earth's surface by rainfall. These radioactive particles include alpha and beta emitters often with short half lives, so the same scan of rainwater done hours or days or weeks later may no longer reveal any radioactivity. The same scientist, from a recent trip to Japan, has indicated that there are "hot spots" of radioactivity in the soil at different locations there, presumably from localized rainfall. In those cases, it would make sense that most of the radiation in the rainwater was from Fukushima. To say the same thing about rainwater here in Prescott, Arizona would require more study, including analysis or baselines of rainfall from pre-Fukushima days, which I do not have. A passing thought - we have a vegetable garden, and I have often wondered how natural rainwater seems to exert a magical, therapeutic effect on the plants, as compared to irrigation water despite its natural mineral content. Could it dare be that a little, naturally-occurring radiation in the rainwater is a good thing?
Update: 5/7/11, 1:30 P.M. - Credibility in Radiation Surveys
When a customer reports back to me that the Geiger counter I sold him is detecting a radiation level of 30 mR/hr (2,500 times normal background) from the pitchblende sample in his mineral collection, I immediately believe him because after all, pitchblende is a common form of uranium ore, is radioactive by definition, and strongly so at that. And because pitchblende is strongly radioactive, a momentary scan of a few seconds is all that is required to immediately identify the object as such. This is in stark contrast to the situation facing us at present, involving potential contamination of objects that are not radioactive by definition. So when a customer reports that vitamins recently shipped from Japan are radioactive because he got a reading as high as 47 CPM (Counts per Minute), I revert to the skeptic with an open mind. From experience, here are the most common reasons that some radiation surveys are not credible:
Study the graph above, with its spikes and troughs, along with the spreadsheet at right that logged radiation count data from one of our Monitoring Stations in the Bay area this morning. First of all, you can see that background radiation is random and erratic. Over the course of 10 minutes, the per minute Count spiked as high as 47, but also troughed as low as 24, about half as much. Also note that the Average Count started out at the trough of 24, but after 10 minutes, moved up to 33 with the benefit of more experience. Finally, you can see that it took about 5 minutes for the randomness of background radiation to average out, so for good measure, a 10 minute average is pretty reliable. Many of you know Aesop's Fable of "The Tortoise and the Hare". Imagine if he was alive today and conducted his own analysis with a Geiger counter, he might pen another fable, "The Spikes and the Troughs", ending with the moral of the story, "Those who would emphasize the spikes must give equal credence to the troughs." The special problem with scanning normally non-radioactive objects and environments for radiation, is that if they are contaminated, it is usually weakly so, hence it is quite easy to confuse a spike in background radiation for radiation from that specific object or environment. So here is the best way to deal with that:
In summary, before some of you wonder if this skeptic can ever be convinced of elevated radiation levels, look at my conversion over the following:
Update: 4/29/11, 9:00 A.M. - False Alerts As a follow up to the previous report, I was able to confirm an equipment malfunction caused what was a false alert (without getting into the nitty gritty of the electronics). Another false alert was triggered this morning from a station in northern Indiana, and yet two more in previous weeks from stations in New Hampshire and British Columbia, respectively. So a reasonable person might ask, "What kind of network are you running here?!!!" Well, I think these false alerts can be classified into 3 distinct categories:
Update: 4/24/11, 11:25 A.M. - Radiation Alert? A radiation alert over 10,000 CPM was just broadcast over the Network from a station in Sidney, BC, Canada. The preliminary explanation is an equipment malfunction. Other stations in the area are showing normal readings. I will follow up with more details later.
Update: 4/22/11, 6:15 A.M.
As discussed before, some of the Stations on the Radiation
Network have improvised outdoor Monitoring systems,
Update: 4/19/11, 8:00 A.M. - More Readings from Japan As the number of Monitoring Stations in Japan on our Network continues to grow, we have a supplemental report from one of our stations located in Yokohama, within 175 miles of Fukushima. While outdoor radiation readings averaged 14 CPM or .14 uSv/hr (normal to somewhat elevated), the same reading on the ground was 20 CPM or .20 uSv/hr, which is definitely statistically significant given the 30 minute averaging period used. For context, Yokohama is using the CRM-100 which is built around the same standard GM tube as the Digilert, and which incorporates a thin mica end window. The higher ground reading from Yokohama is probably (but not necessarily) from fallout, for this reason - the ground reading from Sendai mentioned below, of .5 uSv/hr, was much higher, but Sendai is only 60 miles from Fukushima, so it is not beyond the bounds of reason that the fallout also made its way to Yokohama, but at a lower radiation level. So combining the Yokohama and Sendai reports with that of the Japanese video journalists chronicled farther below, we can make a couple of tentative conclusions:
The point of this exercise is to translate for the US what we could expect from a similar type nuclear event in the US, and what it would mean for the surrounding cities and nearby states.
Update: 4/18/11, 6:20 A.M. - Compatible Radiation Detectors While the supply of Radiation Detectors remains limited, I can report that from recent testing, most or all of the Geiger Counter models manufactured by Images SI in New York are compatible with our Data Cable and Software that runs the Radiation Network. Not that Images SI isn't focused on filling backorders like everyone else now, but there are thousands of their units already out in the marketplace, no doubt many of them stored away. So if you have one, dust it off and plug in to the Network. I have also had many inquiries whether the old civil defense Geiger counter, specifically the CDV-700 model, is compatible. While the original design lacked a data output port, the audio from the headphone jack itself produces the same pulse output, so as long as you can adapt from that fitting to the 1/8" stereo plug of our Data Cable, you should be good to go. And others have improvised interface with models of the Black Cat Systems that are functioning well. Radiation Monitoring in Japan - follow up Our customer in Sendai, who is located 60 miles from Fukushima, is reporting that air samples taken 5 feet above the ground are reading .08 uSv/hr, which is quite normal. This equates to .008 mR/hr, or 8 uR/hr. And since he is using the Inspector model built around the high count rate pancake GM tube, that reading also equates to 24 CPM, which is right in line with readings on the Radiation Map. However, when he placed the Inspector on the ground, with the thin mica end window oriented immediately to the soil, his reading jumped to .5 uSv/hr! His explanation? "The ground level is high due to that the nuclear clouds reached and rain down to the ground." The lesson, here, of course, is that it is not sufficient to monitor environmental (air) radiation levels alone. One cautionary note, though - normally one would not determine a background radiation count by placing the detector on the ground because of possible distortion of readings from any radioactive minerals and radon gas byproduct. But in this case, he was not determining a base background reading, but actually testing the soil for contamination. By the way, I performed a similar test the other day, following a snowfall here in Prescott, Arizona, but came up with no obvious radiation. It should be noted that I was using the standard tubed Digilert, with thin mica window, an excellent all-around model, but still lacking the ultra-sensitivity of the Inspector.
Update: 4/15/11, 6:55 A.M. - Indoor versus Outdoor Monitoring I have written on this subject before, but it has arisen again with a suggestion that our Network's radiation data is incomplete because many of our stations monitor indoors (although a fair number do monitor outdoors). This is true, and I agree that indoor monitoring is not optimal, although the radiation data is still relevant as I have argued many times below. Yesterday, the air here in Prescott, Arizona had a sickly haze to it, not unlike periods when polluted urban atmospheres to the southwest blow through, and conditions were blustery, the spring being our windy season here. On top of this, there were reports of another "plume" passing through. So I disconnected my radiation detector from my office-based, indoor Monitoring Station long enough to take a 10 minute reading of the air outdoors. I am using the Digilert 100 which detects Alpha, Beta, Gamma, and X-radiation through a fairly standard Geiger-Mueller tube. This instrument includes a Total mode for accumulating radiation counts over time, so I set it for 10 minutes and proceeded to walk through the windy haze, holding the instrument at waist level, allowing the Geiger counter with its thin mica end window to "sniff" the air. After 10 minutes of outdoor monitoring, the accumulated count was exactly 210, which equates to 21 CPM (Counts per Minute). I then re-connected to my indoor station and checked the average CPM for the 10 minutes of indoor monitoring immediately preceding the outdoor count, and found that to be 20.7 CPM. The difference of .3 CPM over a 10 minute period is probably not statistically significant, so in summary, in this particular case, the outdoor monitoring revealed nothing that the indoor monitoring did not detect. This is a good and recommended technique for the indoor Monitoring Stations on the Network, to either confirm indoor readings, or to reveal an elevated radiation level that the indoor monitoring is missing. Okay, so my indoor and outdoor readings were the same. But the question is, does the 21 CPM represent an elevated level compared to readings taken before the Fukushima disaster? To answer this question, I reviewed my archived monthly radiation collection data for the same period last year, namely March and April of 2010, and the average readings for both months was 20 CPM. So, that difference of 1 CPM may or may not be statistically significant.
Update: 4/14/11, 6:30 A.M.
Stations Disappeared - I have covered this issue before (see the archive), but many of you continue to email about certain Monitoring Stations disappearing from the Map. Again, this is a volunteer network, and members are just individuals like you and me, who run their stations at their own whim - we can't control that. On the other hand, if we at the Radiation Network intentionally shut down any stations, we would inform you of that along with the reasons for doing so. Network down - Boy, you are an alert group! Many of you sent emails about our Network being down this morning. We were doing some routine server maintenance, and were offline for a few minutes. It was early morning here in Arizona, just 4:00 A.M. Sorry for the inconvenience, and thank you for the notice.
Update: 4/12/11, 6:40 A.M. Radiation Map activity Red Streak - Some have asked about that "red streak" or "red flying saucer-like symbol" that appeared in the San Francisco part of the Map a couple of days ago. That relates to the program's feature of locating Monitoring Stations on the Radiation Map. A station will enter its City, State, and Country, and the program accesses its internal database of cities and their Longitude and Latitude coordinates, and places a colored circle on the Map at that place. On top of that, the program also is equipped to follow mobile Monitoring Stations with a directional arrowed circle when in motion, along with a red lined motion trail. So I think what probably happened is that one of those stations in the Bay area was editing its location and inadvertently created the streak. Honest, no flying saucers were responsible (but seriously, I appreciate your alertness). There was also a momentary false Alert a couple of days ago from a station in New Boston, NH which was just a software glitch - sorry.
Back to the Radiation Network Back to the Message page Click here to go to the next Archive |
 Update: 6/16/11, 7:55 A.M. - Hong Kong online now
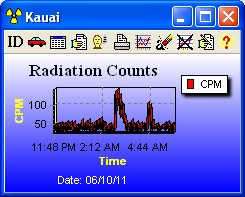
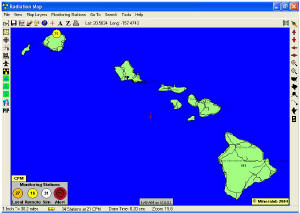 For context, this is the
Kauai station, and
within the Hawaiin archipelago, Kauai is the main island at the far
northwest end of the chain, actually 300 miles from the Big Island of
Hawaii, placing it closest to Japan about 3,500 miles away. And to
boot, the Kauai station is located on the north shore of the island, in
Princeville. You can see the station on the map - the yellow,
numbered circle at top left.
For context, this is the
Kauai station, and
within the Hawaiin archipelago, Kauai is the main island at the far
northwest end of the chain, actually 300 miles from the Big Island of
Hawaii, placing it closest to Japan about 3,500 miles away. And to
boot, the Kauai station is located on the north shore of the island, in
Princeville. You can see the station on the map - the yellow,
numbered circle at top left.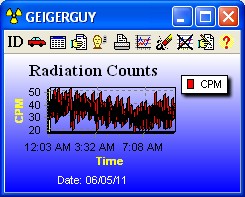 Update:
6/5/11, 6:20 P.M. - Radiation Fallout in Japan
Update:
6/5/11, 6:20 P.M. - Radiation Fallout in Japan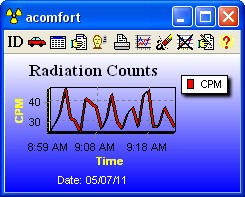 In this
position as both operator of the Radiation Network, and owner of
GeigerCounters.com, a lot of people report back to me on their radiation
surveys. I really like that feedback - it keeps me close to the
action, and provides a learning experience. Having said that, over the 13
years I've used Geiger counters, these reports have come in all
types, and I have learned to adopt a balanced attitude best described as a
skeptic with an open mind. In other words, I can be convinced that
radiation emanated from a specific object or environment, but you have to
convince me. To illustrate the point, here are examples for both extremes from
credible to incredible radiation surveys:
In this
position as both operator of the Radiation Network, and owner of
GeigerCounters.com, a lot of people report back to me on their radiation
surveys. I really like that feedback - it keeps me close to the
action, and provides a learning experience. Having said that, over the 13
years I've used Geiger counters, these reports have come in all
types, and I have learned to adopt a balanced attitude best described as a
skeptic with an open mind. In other words, I can be convinced that
radiation emanated from a specific object or environment, but you have to
convince me. To illustrate the point, here are examples for both extremes from
credible to incredible radiation surveys: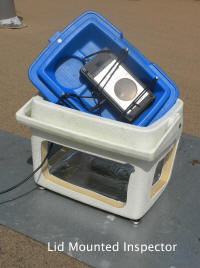 Designing an Outdoor Monitoring
System
Designing an Outdoor Monitoring
System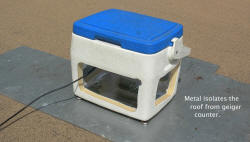 and I feature
here one such design
from a station in the Bay area on the West Coast. This particular
setup is on the roof of a building, and meets the following criteria:
and I feature
here one such design
from a station in the Bay area on the West Coast. This particular
setup is on the roof of a building, and meets the following criteria: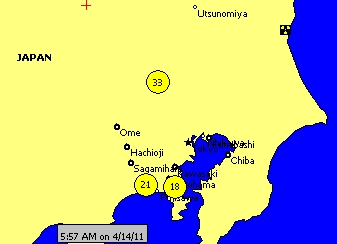 Japan Monitoring - Two more
Monitoring Stations went up in Japan this
morning, one of them located closer to Fukushima than the others, but at 135
miles away, it is well outside the evacuation zone. The station is running
the Inspector model, so its count rate is higher than standard tubed Geiger
Counters. The readings look quite normal for the Inspector - see
the snapshot. So far
then, what we have gleaned from our own network monitoring and other reports out
of Japan, cited below, the required proximity from the Fukushima meltdown in
order to get a detection of elevated radiation levels is somewhere between 20
and 135 miles. We expect some more Monitoring Stations to come online soon
in the Sendai area, which is the largest city in close proximity to Fukushima,
at 45 miles away, so it will be quite interesting and revealing to see what
those radiation levels will be.
Japan Monitoring - Two more
Monitoring Stations went up in Japan this
morning, one of them located closer to Fukushima than the others, but at 135
miles away, it is well outside the evacuation zone. The station is running
the Inspector model, so its count rate is higher than standard tubed Geiger
Counters. The readings look quite normal for the Inspector - see
the snapshot. So far
then, what we have gleaned from our own network monitoring and other reports out
of Japan, cited below, the required proximity from the Fukushima meltdown in
order to get a detection of elevated radiation levels is somewhere between 20
and 135 miles. We expect some more Monitoring Stations to come online soon
in the Sendai area, which is the largest city in close proximity to Fukushima,
at 45 miles away, so it will be quite interesting and revealing to see what
those radiation levels will be.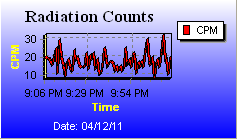 Radiation in Japan - Many of you have noticed the new
Monitoring Station in Japan - see the Map by that name. This station
is in a far southwest suburb of Tokyo and is recording rather normal
environmental radiation readings
from indoors - he is 175 miles away from Fukushima (see graph at right).
Which brings up another point. Those video reporters in Japan chronicled
below, on the course of their journey to Fukushima, were at least
initially monitoring from the "relative" indoor safety of their car, but
their dashboard mounted detectors documented just how safe (or unsafe)
that was. The steel and glass exteriors of the car proved ineffective at
stopping the radiation from penetrating. This illustrates how even
indoor monitoring can be relevant, when in close enough proximity.
Radiation in Japan - Many of you have noticed the new
Monitoring Station in Japan - see the Map by that name. This station
is in a far southwest suburb of Tokyo and is recording rather normal
environmental radiation readings
from indoors - he is 175 miles away from Fukushima (see graph at right).
Which brings up another point. Those video reporters in Japan chronicled
below, on the course of their journey to Fukushima, were at least
initially monitoring from the "relative" indoor safety of their car, but
their dashboard mounted detectors documented just how safe (or unsafe)
that was. The steel and glass exteriors of the car proved ineffective at
stopping the radiation from penetrating. This illustrates how even
indoor monitoring can be relevant, when in close enough proximity.